Introduction
The Study library (STX.Studies) provides tools, methods and interfaces developers can use to build custom Studies or Indicators.
Studies and Indicators (collectively referred to as studies in this documentation) may be displayed in a dedicated panel or as overlays on the chart.

Generally speaking, there are 3 basic parts to creating studies:
- Study Registration
Custom studies must be registered/declared before they can be used, by adding a StudyDescriptor object to the StudyLibrary. On load, the system will read these descriptors and make them available.
The calculation portion
Values can be calculated real time, browser side, based on data already in the dataSet, or a pre-calculated value can be added to the dataSet and simply passed on to the visualization portion.
The visualization portion
With some knowledge of HTML5 canvas you can create your own visualizations, or leverage the included convenience functions for drawing lines based on a single or group of series ( STX.Studies.displaySeriesAsLine ), drawing histograms based on a single or group of series ( STX.Studies.displaySeriesAsHistogram ), displaying channels ( STX.Studies.displayChannel ), creating shaded areas ( STX.Studies.fillArea ), rendering histograms ( STX.Studies.createHistogram ), displaying a histogram with lines together ( STX.Studies.displayHistogramWithSeries ), and more. For a complete list of methods, see STX.Studies.
 **Note the convention to use sd.name+"_hist" for histogram values when calling STX.Studies.createHistogram and STX.Studies.displayHistogramWithSeries.**
 This practice allows the histogram data to coexist with the line data which also uses the sd.name as its field name in the provided calculation functions.
The study library and complete code for all studies is available in the license package. Feel free to use them as reference to create your own customizations.
On version 04-2015 and prior this code can be fond in stx.js.
On versions post 04-2015, you can find them in stxLibrary.js, with advanced studies in stxAdvacned.js.
For reference, we are also including sample code throughout in this guide.
The interface allows for the addition of multiple copies of the same study so long as the parameters are different. So for instance you can add a 14 period ADX and a 15 period ADX, but if you try to add two studies with the exact same parameters then the system will perceive it as a replacement rather than an additional study.
Click HERE for formulas and additional details on existing studies
Declaring and registering a study
The following outlines the template format required to register a study into the library.
STX.Studies.studyLibrary[myName]={
    // parameter objects in here
}
The following is an example of a study registration using many of the parameters available. You can further add any other parameters you need; they will be included in the study descriptor for you to access on both the calculation and display functions:
STX.Studies.studyLibrary[myName]={
  "name":"StudyName"                                    // name to appear on the menus  and configuration pop-ups
  "display": "MyPrettyName",                              // display name on the study panel.
  "overlay": false,                                     // true if it appears over the chart like a MA
  "inputs": {"id": "MyStudyNameOverride","Period":14},     // list of inputs to display in dialog
  "outputs":{"Slow":"#000000","Fast":"#0000FF"},         // outputs to display
  "initializeFN": fn1,                                     // null usually, or override with your custom initializer (which should call STX.initializeFN)
  "removeFN": fn5,                                         // null usually, or override with your custom removal
  "calculateFN": fn2,                                     // function for calculating the study
  “seriesFN": fn3,                                         // null if you just want to display one or more lines, otherwise a custom rendering function
  "yAxisFN": fn4,                                        // if defined  then it will be used to render the yaxis instead of STXChart.createYAxis.
  "yAxis": {                                            // optional YAxis object to manipulate any aspect of the yAxis on study panels. Not to be used with overlay studies. ( See STXChart.YAxis )
    displayGridLines: true,
    minimumPriceTick:.25,
    max:1,
    min:0,
    initialMarginTop:0,
    initialMarginBottom:0,
    noDraw:true,
    displayGridLines: false,
    drawCurrentPriceLabel: false,
    drawPriceLabels: true,
    yaxisLabelStyle: "noop",
    priceFormatter: function(stx, panel, price) { return Math.round(price * 100) + '%'; }
  },
  "range":"bypass",                                     // usually null
  "nohorizontal":true,                                     // otherwise a line will display at the zero value
  "edit": null,                                            // optionally turn off the edit button in this study
  "panelHeight": 20,                                    // optional field to specify the initial height of a newly added panel in pixels.
  "feed": {quoteFeed:sentimentFeed, label:"STOCKTWITS", behavior:{fields:["Sentiment", "Message Volume"]}}    // Optional data feed to be used in addition to the attached quote feed.
 };
Each of the functions above (fn1, fn2, fn3, fn4) are developer provided functions that initialize, calculate and render the study. In your code, be sure to place (load/include) these functions so they are defined before the StudyDescriptor or they will not be found by the descriptor!
Parameters in detail
myName – This is the key used to build the internal unique identifier for the study (study descriptor name - sd.name). sd.name will be assembled automatically by combining myName plus the study input parameters.
Example: Alligator (13,8,8,5,5,3).
This automatic assembly can be overridden, and instead you can specify an internal unique identifier of your choice. This is done by sending your id as part of the input object. Example: inputs:{"id": "MyStudyNameOverride"}
This identifier will be used in the default calculation and rendering library functions as the key for the name fields to store/find the study value in the dataSet ( see outputs ) and will also appear in the label for the panel unless the display parameter is defined.
name – This is the label that will appear on the study list menu (for version using the dynamically generated menu) and dialog pop-ups. If not set, myName will be used.
display – This is the label that will appear on the study panel or overlay label once the study has been rendered. If not set, the internal name will be used. If adding programatically see STX.Studies.addStudy for instructions on how to define a name for the study.
overlay – If true then the study will be overlaid on the chart (like a moving average), otherwise a panel will be created for the study.
inputs – This defines the input types for the study and their corresponding default values. These values will be made available to the calculation function.
If no input fields are defined, then "period:14" will be the automatically added, and the only input parameter presented to the user and sent to the calculation function.
If using the provided study dialogs, input fields will automatically appear on the dialog creation pop-up. Depending on type, a different input format will be used as follows:
- Boolean values will create a checkbox
- Numeric values will create an input box.
- A string of "ma" will present a select box of moving average types.
- A string of "field" will present a select box of all of the available fields (open, high, low, etc).
- An array of strings will display a custom select box.
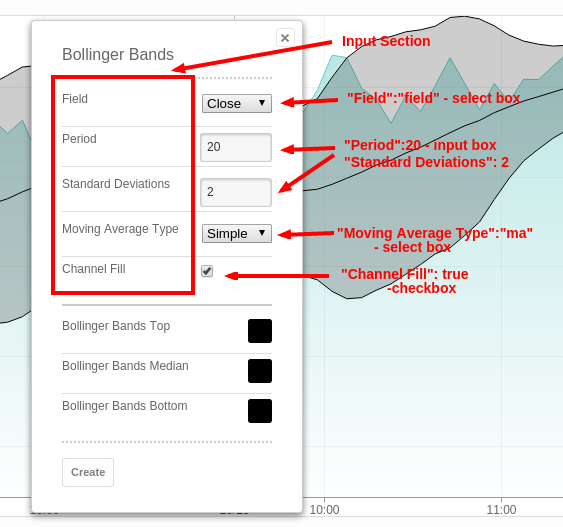
This is an example of the definition for the Bollinger Bands. Look at the "inputs"
            "Bollinger Bands": {
                "name": "Bollinger Bands",
                "overlay": true,
                "initializeFN": STX.Studies.convertOldBollinger,
                "calculateFN": STX.Studies.calculateBollinger,
                "seriesFN": STX.Studies.displayChannel,
                "inputs": {"Field":"field", "Period":20, "Standard Deviations": 2, "Moving Average Type":"ma", "Channel Fill": true},
                "outputs": {"Bollinger Bands Top":"auto", "Bollinger Bands Median":"auto", "Bollinger Bands Bottom":"auto"}
            }
This is what the dialog will show:
outputs – This defines the colors to be used by the seriesNF for each field calculated in the calculateFN.
If using the provided menu interface, these fields will be displayed in the study dialog box to allow the user to change the defaults by using a color palette.
To allow studies to share rendering functions regardless of output names, an outputMap object is automatically created and included in the study descriptor (sd.outputMap). This map normalizes the relationship between the fields created and the corresponding outputs.
The normalized map follows strict rules for generating a unique key per filed/value pair. If using the provided study display functions, your calculate function must exactly adhere to these naming conventions when adding a new field, or the display function will not be able to properly identify the output values.
The default format used to identify the data element is: <output name> + “ ” + sd.name.
If no calculation function is defined, it will be assumed that the data is already a field in the masterData; either one of the standard OHLC elements, or an additional element added to the masterData array server side. In that case, the study name will be excluded and only the output name will be used as the key for that color in the outputMap. So if you are looking to display the High price, for example, your output field must match this field name.
Example of a study library entry:
    STX.Studies.studyLibrary["Plot High"]={
     outputs:{"High":"blue"}
    };
Example of an outputMap for the above study library :
sd.outputMap: {High: "High"}Example of an output list for the above study library :
sd.outputs: {High: "blue"}So the color will be sd.outputs[sd.outputMap[i]], regardless of what you named your output fields.
Your code to add a study field will be as follows:
quotes[i]["sampleStudyOutput "+sd.name]=/*the calculation for this data point*/;Of course, if you are using your own custom calculation and display functions, you have full control over the field names, but must make sure your calculation function is adding the elements that your display function will be looking for.
initializeFN – Optional. Provide a function that should be called to initialize the study when it is first loaded by the library. Usually this can be left undefined as the default functionality will work for most studies.
See STX.Studies.initializeFN for all the details.
Example:
STX.Studies.studyLibrary["studyName"].initializeFN= theInitializeFN(stx, type, inputs, outputs, parameters, panelName);removeFN – Optional. Provide a function that should be called to clean up the study when it is removed by the library. Usually this can be left undefined as the default functionality will work for most studies.
The function takes 2 arguments:
- stx = the chart object
- sd = the study descriptor
Example:
STX.Studies.studyLibrary["vol undr"].removeFN= function(stx, sd){
        stx.layout.volumeUnderlay=false;
        stx.changeOccurred("layout");
},
calculateFN – Required, this function calculates the data set for the studies. You are only guaranteed OHLCV data to be available. This function should set new members in the dataSet which will then be referred to by the rendering methods.
Studies render best when there are no gaps (null elements) in the dataSet. By default our library removes these null entries (scrubbing) and creates a new array called 'chart.scrubbed'. All studies should use the sd.chart.scrubbed instance of the sd.chart.dataSet.
This default can be disabled if desired; in which case chart.scrubbed will still exists, but will be identical to stx.chart.dataSet and will have gaps. See STXChart#dataSetContainsGaps for details.
The function takes 2 arguments:
- stx = the chart object
- sd = the study descriptor
Example:
sd.libraryEntry.calculateFN(stx, sd);Reminder:
initializeFNandcalculateFNmust always be declared before theSTX.Studies.studyLibrarydefinition.- The new dataSet elements inserted should be of the following form:
<output name> + “ ” + sd.name.This allows the charting engine to display multiple versions of your study with different parameters. By following this convention, _displaySeriesAsLine will work automatically. For instance when enabling RSI, this is what chart.dataSet will look like:
console.log(stxx.chart.dataSet[0]);
"Open": 100,
"Close": 100,
"High"": 100,
"Low": 100,
"Volume": 5000,
“RSI rsi(14)”:45.60232
If you had two RSI panels open it might look like this:
console.log(stxx.chart.dataSet[0]);
"Open": 100,
"Close": 100,
"High"": 100,
"Low": 100,
"Volume": 5000,
“RSI rsi(14)”:45.60232,
“RSI rsi(26)”:56.12121
If a study only has one value and no explicit output entry has been declared, then by default it will be named “Result”:
console.log(stxx.chart.dataSet[0]);
“Open”: 100,
“Close”: 100,
“High””: 100,
“Low”: 100,
“Volume”: 5000,
“Result cog(14)”:45.60232
seriesFN – SeriesFN renders all of the data points in one fell swoop, such as when drawing a moving average line across a chart. If left undefined then by default STXStudies.displaySeriesAsLine will be called (if your study is a simple line then this will likely work for you). If your study displays multiple lines then displaySeriesAsLine will be called for each calculated point. The calculated points and colors are defined by "outputs".
The function takes 3 arguments:
- stx = the chart object
- sd = the study descriptor
- quotes = array of tick objects to be used for the display
Example:
sd.libraryEntry.seriesFN(stx, sd, quotes);The calculate function output will always be available in chart.dataSet and chart.dataSegment to be used by the display function.
yAxisFN – YAxisFN is an optional function that if defined will be used to render the yaxis instead of STXChart.createYAxis.
The function takes 2 arguments:
- stx = the chart object
- sd = the study descriptor
Example:
sd.libraryEntry.yAxisFN(stx, sd);yAxis – yAxis is an optional object which will be appended to the corresponding study panel's yAxis. Similar to jquuery.extend() with a deep copy. This gives developers full access to the yAxis elements and allows them to control every aspect.
Not to be used with overly studies
range – Optional. By default the min and max of the study panel are determined automatically by the function STXStudies.determineMinMax.
Range can be optionally set to :
- "0 to 100"
- "-1 to 1"
- "0 to max"
- "bypass"
Note: If "bypass" is set, then the calculation function must set the range (panel.min and panel.max).
Example:
- In study library entry you would add:
"range": "bypass" - In your calculation function you would add:
var panel = stx.panels[sd.panel];
panel.min= -30; // your y-axis min value here
panel.max= 30;    // your y-axis max value here
nohorizontal – Optional. By default, a horizontal line is drawn at the zero point for study panels. Set this to true to override this behavior.
parameters – Optional object containing additional custom parameters required by a study. See the implementation of overbought and oversold zones for RSI as an example.
feed – Optional data feed to be used in addition to the attached quote feed, such as a 'sentiment' data feed to correlate public opinion data over market data.
It calls STXChart#attachTagAlongQuoteFeed
Adding a user interface
Using built in dialogs
You have to manually add a menu item on your user interface for any new study and link it to the library. This will allow it to be activated when the user selects it. Lets assume we are adding the Klinger study. In STX.Studies.studyLibrary={} on stxLibrary.js, you would need the following study definition:
"Klinger": {
            "seriesFN": STX.Studies.displayKlinger,
            "calculateFN": STX.Studies.calculateKlinger,
            "inputs": {"Signal Periods":13, "Short Cycle": 34, "Long Cycle": 55},
            "outputs": {"Klinger":"auto","KlingerSignal":"#FF0000"}
        },
In the menu listing (by default found in your main html page -- stx-advanced.html, for example), you will need the following item :
<li stxToggle="studyDialog(this, "Klinger");">Klinger Volume Oscillator</li>As long as the study name on the studyDialog matches the study name on the studyLibrary ("Klinger" in this sample), the charting application will link the menu item to the library (and related study logic) and then execute the defined functions when selected.
Using Custom study interfaces and menus
You can call studyDialog(div, 'study name') (div parameter is not required) from your HTML menus as an onclick action or explicitly from your code:
Example:
function displayChart(){
  restoreLayout();
  runSampleUI();
  stxx.setPeriodicityV2(1, 5);
  STXLoader(true);

  var newSymbol = "SPY";
  var qsParm=STX.qs();    // Query string parameters
  if (qsParm["symbol"]) newSymbol = qsParm["symbol"];    // if a symbol was passed in as a query string, then use it.

  stxx.newChart(newSymbol, null, null, finishedLoadingNewChart(stxx.chart.symbol, newSymbol));

  studyDialog('', 'Elder Ray'); // this will cause the Elder Ray study dialog to pop-up when the chart is initially displayed. The user can then select settings and add.
}
The actual library call to create the dialog based on the corresponding HTML is : STX.Studies.studyDialog(stxx, study, $$("studyDialog"));
The call to display it is: STX.DialogManager.displayDialog("studyDialog");
The code for that function is on the sample HTML page provided in your package:
function studyDialog(obj, study){
 if(!stxx || !stxx.chart.dataSet) return;
 if(STX.Studies.studyLibrary[study] && STX.Studies.studyLibrary[study].name) $$("studyDialog").querySelectorAll(".title")[0].innerHTML=STX.Studies.studyLibrary[study].name;
 else $$("studyDialog").querySelectorAll(".title")[0].innerHTML=study.capitalize();
 STX.Studies.studyDialog(stxx, study, $$("studyDialog"));
 var delay=STX.ipad?400:0; // so that ipad doesn't register taps from menu selection on dialog
 setTimeout(function(){
    STX.DialogManager.displayDialog("studyDialog");
  }, delay);
}
You can also create your own menus and then just call STX.Studies.go($$("studyDialog"), stxx);
You must carefully maintain all of the studyDialog element id and class names outlined in the sample code, which are used in the code to convert the menu into actual study input parameters. See STX.Studies.go
Or if you want to manage all of the data gathering, and and not have to follow any guidelines for the data menus, just collect the data any way you want to and then use STX.Studies.addStudy to add the study to the chart with your own inputs and outputs.
Example:
var inputs= {"Period":200,"Field":"field","Type":"ma"};
var outputs= {"MA":"red"};
STX.Studies.addStudy(stxx, "ma", inputs, outputs);
See STX.Studies for more details.
Input validation
By default, the study dialog does not perform any field validation. It is left to the developer to define and implement any required rules by overriding the STX.Studies.go method.
The following is a simple example on how to validate the Period parameter. Your code can iterate trough every element in the sd.inputs, sd.inputs and sd.outputs objects to check each one as needed.
  STX.Studies.go=function(div, stx){
        var sd=STX.Studies.parseDialog(div, stx);
        // add code here to validate all sd.inputs, sd.inputs, sd.outputs and sd.parameters
        // if all is well continue to call addStudy
        // if there is an issue you can stop, programatically adjust it and continue, or pop up some sort of message.
        //Example:
        if( sd.inputs.Period < 1 ) {
            alert("Invalid Period");
            studyDialog(null, div.study);
        } else {
            sd=STX.Studies.addStudy(div.stx, div.study, sd.inputs, sd.outputs, sd.parameters);
            return sd;
        }
};
You can put the override function on your HTML file.
Adding and removing a Study Programatically
Adding a study
To add a study programatically use STX.Studies#addStudy. You should generally place this in the callback from STXChart#newChart.
In this example we programatically add a 50 day moving average after creating a chart, and disable the ability for users to remove the panel.
stxx.newChart(symbol, null, null, function(){
    var sd= STX.Studies.addStudy(stxx, "ma", {Period:50, Field:"Close", Type:"simple"}, {MA:"#FF0000"});
});
You can then access the calculations programatically:
var ma50=stxx.currentQuote()["ma MA (50,Close,simple)"];When programatically adding a study, know that if you specify input and/or output objects, those are the ones that will be used and will not be combined with the library defaults. So even if you only want to define or override one single element (display, for example); you them must also send all of the additional inputs required to render the study. If on the other hand you leave the input or output parameters out, the defaults will be used.
Example:
    STX.Studies.addStudy(stxx, "ma", {Period:50, Field:"Close", Type:"simple",display:"name"}, {MA:"#FF0000"});
    STX.Studies.addStudy(stxx, "Aroon", {Period:14,display:"name2"});
Please note that the order of the fields in your input object is the order in which they will appear in the naming convention!
Example:
A note on adding a moving average to an existing study: Although you can add a moving average to any study that is already rendered, you must make sure the correct study names and field names are used.
For example if adding a MA to the Volume study, first you must make sure the volume study is present and named vchart. This name is a requirement and automatically used when adding via the UI. If this name is not used, the MA will not find the study.
If not there, add it:
STX.Studies.addStudy(stxx, "vchart", {}, {"Up Volume":"#8cc176","Down Volume":"#b82c0c"});Then, you can add a moving average to it:
STX.Studies.addStudy(stxx, "ma", {
        Field: "Volume",
        Offset: 0,
        Period: 50,
       Type: "simple",
       Underlay: false
});
For all other studies, the field must be a valid name in the STX.Studies.studyPanelMap
Example:
STX.Studies.addStudy(stxx, "ma", {
        Field: "Aroon Up Aroon (14)",
        Offset: 0,
        Period: 50,
       Type: "simple",
       Underlay: false
});
Making as study permanent
To prevent users from removing a study that was programatically added, set the study descriptor's permanent flag to true
Example:
stxx.newChart(symbol, null, null, function(){
    var sd= STX.Studies.addStudy(stxx, "ma", {Period:50, Field:"Close", Type:"simple"}, {MA:"#FF0000"});
    sd.permanent=true;    // Optionally prevent users from deleting the study

});
Removing a Study
To programatically remove a study simply call STX.Studies.removeStudy
STX.Studies.removeStudy(stxs,sd);Adding a 'clear all studies' function call
You can create a 'clear all' function by looping trough the list of studies and deleting them one at a time.
Here is the code you will neeed:
var s=stxx.layout.studies;
if(!s) return;
for(var n in s){
    var sd=s[n];
    STX.Studies.removeStudy(stxx,sd);
}
Simple study sample code
Calculation:
        STX.Studies.calculateSampleStudy=function(stxx, sd){
            var quotes=sd.chart.scrubbed;
            for(var i=0;i<quotes.length;i++){
            quotes[i]["Result " + sd.name]=// put your formula here;
            }
        };
Study library entry:
        "sampleStudy": {
            "calculateFN": STX.Studies.calculateSampleStudy,
            },
Study call (in the newChart callback()):
STX.Studies.addStudy(stxx, "sampleStudy");Creating Custom Studies: Calculations
The following is an example on how a custom calculation would be defined. This code is used to calculate the values that will be used to render a RSI study. The function name must match the value registered under "calculateFN"
        /**
         * A sample study calculation function. Note how sd.chart.scrubbed is used instead of dataSet. Also note the naming convention
         * for the outputs.
         * @memberOf STX.Studies
         */
        STX.Studies._calculateRSI=function(stx, sd){
            var quotes=sd.chart.scrubbed;
            function computeRSI(avgGain, avgLoss){
                if(avgLoss==0) return 100;
                var rs=avgGain/avgLoss;
                return 100-(100/(1+rs));
            }
            if(quotes.length<sd.days+1){
                if(typeof practiceMode!="undefined" && practiceMode) return;
                //STX.alert("Not enough quotes to compute RSI"); // TODO watermark
                return;
            }
            var gain=0, loss=0;
            for(var i=1;i<sd.days;i++){
                var change=quotes[i].Close-quotes[i-1].Close;
                if(change<0) loss+=(change*-1);
                else gain+=change;
            }
            var avgGain=gain/sd.days;
            var avgLoss=loss/sd.days;
            quotes[i][sd.name]=computeRSI(avgGain, avgLoss);
            var name="RSI " + sd.name;
            for(var i=sd.days;i<quotes.length;i++){
                var quote=quotes[i];
                var change=quote.Close-quotes[i-1].Close;
                if(change>0){
                    avgGain=((avgGain*(sd.days-1))+change)/sd.days;
                    avgLoss=avgLoss*(sd.days-1)/sd.days;
                }else{
                    avgLoss=((avgLoss*(sd.days-1))+(change*-1))/sd.days;
                    avgGain=avgGain*(sd.days-1)/sd.days;
                }
                quote[name]=computeRSI(avgGain, avgLoss);
            }
            sd.zoneOutput="RSI";
        };
When a study is calculated, the calculated value must be added to the quotes that are passed in (this is the dataSet that is being passed in). These newly calculated values will eventually be used by the display function to display the study. It's important to follow a standardized naming convention because:
- The display function needs to know which field to display
- The chart must support multiple studies with different parameters, such as 20,50 and 200 day moving averages!
The naming convention for a study field is:
<Ouput name> <study name> (<list of input parameters>)For instance a moving average would be found like so:
var ma20Value=quote["MA ma (20,simple,Close)"];If there are no inputs then the parentheses will be left out. For example the "Highest High Oscillator":
var highLow=quote["Result High-Low"];By default if there are no outputs assigned then the name of the output will be "Result" as in the TRIX oscillator:
var trixValue=quote["Result TRIX (50)"];Some studies have multiple outputs such as Aroon:
"Aroon Up Aroon (50)"
"Aroon Down Aroon (50)"
You might also discover, and can create, non-displaying calculations. For instance you may create a custom study that requires a moving average. Feel free to call the base calculation function. It won't actually display unless the user has selected this from the interface (that is, it won't show up in stxx.layout.studies simply because you call the calculate function)
function myCalculationFunction(stx, sd){
    var sd2=new STX.Studies.StudyDescriptor(sd.name, "ma", sd.panel);
    sd2.chart=sd.chart;
    sd2.days=50;
    sd2.inputs={Field:"Close", Type:"simple"};
    STX.Studies.calculateMovingAverage(stx, sd2);
    // Now the moving average has been created. The result can be found in sd.chart.scrubbed

    // Use the MA to do your own custom calculation and store it
    for(var i=0;i<sd.chart.scrubbed.length;i++){
        var ma50=sd.chart.scrubbed.length[i][ma MA (50,simple,Close)];
        sd.chart.scrubbed.length[i]["Result " + sd.name]=ma50*blah;
    }
}
Creating Custom Studies: Display
Example
STXStudies.displayMACD=function(stx, sd, quotes) {
  STXStudies.createHistogram(stx, sd, quotes, true);
  STXStudies.displaySeriesAsLine(stx, sd, quotes);

// do any other canvas manipulation in here

}
displayMACD is a series display. The stx object is the chart object. sd is the StudyDescriptor. quotes is the dataSegment to display.
There is another example for displaying the Klinger study:
        /**
         * A sample of a custom display function. This function creates the yAxis, draws a histogram and then plots the series
         * @memberOf STX.Studies
         */
        STX.Studies.displayKlinger=function(stx, sd, quotes) {
            var panel=stx.panels[sd.panel];
            STX.Studies.createYAxis(stx, sd, quotes, panel);
            STX.Studies.createHistogram(stx, sd, quotes);
            STX.Studies.displaySeriesAsLine(stx, sd, quotes);
        };
Finally, here is a more advanced example of an overlay study :
        /**
         * A sample display function for an overlay. An overlay displays in the chart area.
         *
         * Also note the use of clipping to ensure that the overlay doesn't print outside of the panel
         *
         * Finally note that when color=="auto" you can use stx.defaultColor which will automatically adjust based on the background color. This
         * is the default for studies that use the color picker for user selection of output colors.
         * @memberOf STX.Studies
         */
        STX.Studies.displayPSAR2=function(stx, sd, quotes){
            stx.startClip(sd.panel);
            var squareWave=(sd.inputs["Plot Type"]=="squarewave");
            for(var output in sd.outputs){
                var field=output + " " + sd.name;
                stx.chart.context.beginPath();
                for(var x=0;x<quotes.length;x++){
                    var quote=quotes[x];
                    if(quote==null || quote[field]==null) continue;
                    if(stx.panels[sd.panel].name==sd.chart.name && quote.transform) quote=quote.transform;
                    var x0=stx.computePosition(x, 0);
                    var y0=stx.pixelFromPrice(quote[field], stx.panels[sd.panel]);
                    if(x==0 || !quotes[x-1] || quotes[x-1][field]==null) {
                        stx.chart.context.moveTo(x0,y0);
                    }
                    if(squareWave) {
                        stx.chart.context.lineTo(x0,y0);
                        stx.chart.context.lineTo(x0+stx.layout.candleWidth, y0);
                        if(quotes[x+1]){
                            var quote_1=quotes[x+1];
                            if(stx.panels[sd.panel].name==sd.chart.name && quote_1.transform) quote_1=quote_1.transform;
                            if(quote_1[field]==null){
                                stx.chart.context.lineTo(x0+stx.layout.candleWidth, stx.pixelFromPrice(quote_1[sd.referenceOutput + " " + sd.name], stx.panels[sd.panel]));
                            }
                        }
                    }else{
                        stx.chart.context.moveTo(x0,y0);
                        stx.chart.context.lineTo(x0+3, y0);
                    }
                }
                stx.chart.context.lineWidth=1;
                if(sd.highlight) stx.chart.context.lineWidth=3;
                var color=sd.outputs[output];
                if(color=="auto") color=stx.defaultColor;    // This is calculated and set by the kernel before draw operation.
                stx.chart.context.strokeStyle=color;
                stx.chart.context.stroke();
                stx.chart.context.closePath();
            }
            stx.endClip();
        };
Convenience functions are available for drawing to the chart:
stx.pixelFromBar(x) - returns the horizontal position of the tick.(Note that stx.layout.candleWidth contains the current bar width for the chart).
stx.pixelFromPrice(price, panel) - returns the vertical position for a given price (or value for a panel).
stx.plotLine(x0, x1, y0, y1, color, type) - draws a line on the screen and automatically crops to the edges of the panel display. This can take an actual color or a css class containing a color.
stx.canvasColor(cssName) - returns the color given a css class name.
stx.canvasFont(cssName) - returns a canvas compatible font string give a css class name.
Here is a simple example of a display function using the above (creates dots):

Server side study data
Studies can be client side or server side - the only difference is how the values are derived.
To add data elements to your dataSet, you can use STXChart#addSeries (exclude the color field so it won't render in the main panel), or just add it manually like this:
for(var i=0;i<stxx.masterData.length;i++){
    stxx.masterData[i]["field1"]=yourServerSideValue[x];
}
// always call createDataSet() when changing the masterData
stxx.createDataSet();
Imagine you already have data labeled 'field1' and 'field2' loaded into the dataset. All you want to do now is create a study panel to display them as lines. You want this panel to automatically render whenever the chart is loaded with no option for the user to remove it.
This sampe code outlines the process:
First define your study by adding an entry to the Study library
  STX.Studies.studyLibrary["MyStudy"] = {
    outputs: {
      "field1": "blue",
      "field2": "purple"
    }
  };
Then, programatically place the series on the chart:
STX.Studies.addStudy(stxx, "MyStudy");Example:
Study Panel size manipulation
See Adjusting initial Panel height tutorial for instructions on how to manage panel sizes.
You can also programatically move the panes up or down to find the desired location.
STXChart#panelUp moves the panel one place up, and STXChart#panelDOwn moves it one place down.
The STXChart#panels object tracks the panels in the exact display order, so traversing trough it will allow you to know where a panel is and use that information to progrmatically move it as needed.
      for(x in stxx.panels){
        alert(stxx.panels[x].name);
      };
Before a panel can be moved, it needs to first be added. By default all new panels are added to the bottom of the chart.
You can do this, for example, to add a volume study and move it up one place:
      STX.Studies.addStudy(stxx, "volume", {}, {"Up Volume":"#8cc176","Down Volume":"#b82c0c"});
      stxx.panelUp(stxx.panels.volume);
Can I have all my custom studies on a separate js file?
Yes. You can have all of your custom studies reside on a separate JS file and then just include that file on your main html file as such:
</script>
<script src="myStudyFile.js"></script>
</body>
</html>
Your study file will have the study library declarations and any custom functions they call.
For example:
function calculatex(stx, sd){
 // code here
};

function renderx(stx,sd,quotes){
  // code here
}

STX.Studies.studyLibrary["studyx"]={
  "inputs": {},
  "seriesFN": renderx,
  "calculateFN":calculatex,
  "range": "0 to 100",
  "outputs":{"Something":"#FF0000"},
  "parameters": {"something":0}
};
Overriding Study Library defaults
It is recommended that you do not directly make changes to the default study library definitions . This will allow you to easily upgrade once a new release is avaialbe without haivng to marge your changes to the new version.
Instead set/reset your values by overriding the study declaration; making sure your files are loaded after the library js files -- not before.
Here is an example of how to add the offset parameter to the Moving Average study:
STX.Studies.studyLibrary["ma"]["inputs"]["Offset"]=0;
You can add this to your main html file, or your separate study js file if you have one.
Example on how to change the default colors for the volume underlay:
you would add the following code in your files
STX.Studies.studyLibrary["vol undr"].outputs= {"Up Volume":"blue","Down Volume":"yellow"};The following is an example on how to override the rendering function for a volume underlay:
This example renders all of the bars in gray with no borders and a wide margin between them.
Example:
Add the following to your main HTML file or java script file (as long as it is loaded after the standard library files):
 STX.Studies.studyLibrary["vol undr"].seriesFN=function(stx, sd, quotes){
   var seriesParam=[{
    field: "Volume",
    fill_color_up:    stx.canvasStyle("stx_volume_underlay_up").color,
    border_color_up:    stx.canvasStyle("stx_volume_underlay_up").borderLeftColor,
    opacity_up:    stx.canvasStyle("stx_volume_underlay_up").opacity,
    fill_color_down:    stx.canvasStyle("stx_volume_underlay_down").color,
    border_color_down:    stx.canvasStyle("stx_volume_underlay_down").borderLeftColor,
    opacity_down:    stx.canvasStyle("stx_volume_underlay_down").opacity
   }];
   var params={
    name: "Volume",
    panel:    sd.panel,
    heightPercentage:    sd.inputs.HeightPercentage?sd.inputs.HeightPercentage:sd.study.parameters.heightPercentage,
    widthFactor:    .75
   };
   stx.drawHistogram(params,seriesParam);
 };
Then you can customize the drawHistogram parameters to render it exactly as you want it. See STXChart#drawHistogram for more details.
Custom studies and the quotefeed.
Some custom studies may need additional data elements form the quote feed. For example, a study may need to also use high,low and last for 3 other symbols in order to compute the study values. By default our library only loads the last price for any secondary symbol. To load your custom data, you will need to add your own custom processing function in the quoteFeedCallback multiFetch defined by the quoteBehavior object used to attach to the STX.QuoteFeed. For full quote feed implementation details, see the Pull Method tutorial.
This is an example:
If you quote feed was attached as follows:
var quoteBehavior={
  refreshInterval: 15,
  callback: quoteFeedCallback
};
stxx.attachQuoteFeed(new STX.QuoteFeed.Demo(),quoteBehavior);
Your callback function will look similar to this (you can find the default quoteFeedCallback code in stx-advacned.html):
function quoteFeedCallback(params){
    //use to determine startDate for a comparison if params.update=true
    function getStartDate(symbol){
        for(var c=params.stx.masterData.length-1;c>=0;c--){
            if(params.stx.masterData[c] && typeof params.stx.masterData[c][symbol] != "undefined"){
                return STX.strToDateTime(params.stx.masterData[c].Date);
            }
        }
        return params.startDate;
    }

    // set  additional comparison series data to load
    var syms={};
    for(var field in params.stx.chart.series) {
        if(!params.stx.chart.series[field].parameters.isComparison) continue;
        syms[field]=true;
    }

    // set additional study data to load
    for(var p in params.stx.panels){
        if(params.stx.panels[p].studyQuotes){
            for(var sq in params.stx.panels[p].studyQuotes) syms[sq]=true;
        }
    }

    //set the multifetch pparameters for all the additional symbols to load
    var arr=[];
    for(var field in syms){
        var seriesParam=STX.shallowClone(params);
        seriesParam.symbol=field;
        if(seriesParam.update) seriesParam.startDate=getStartDate(field);
        arr.push(seriesParam);
    }
    if(arr.length==0) return;
    var driver=params.stx.quoteDriver;

    // execute the multifetch call
    driver.quoteFeed.multiFetch(arr, function(results){
        for(var i=0;i<results.length;i++){
            var result=results[i];
            if(!result.dataCallback.error){
                // call the default processing routine
                STX.AddMemberToMasterdata(params.stx, result.params.symbol, result.dataCallback.quotes);

                // call your custom processing routine to load as much of the response as needed by your studies.
                STX.Studies.customDataLoader(params.stx, result.params.symbol, result.dataCallback.quotes);
            }
         }
        params.stx.createDataSet();
        params.stx.draw();
    });
}
See STX.AddMemberToMasterdata in stx.js for reference on how to build your custom loading function.
Once this is done, every time the main symbol needs new data, your custom fetch will also be called to load the additional data needed for your studies.
It is important to understand there are several reasons why the library will fetch data. One is the refreshInterval defined in the quoteBehavior , which we have set to 15 seconds. Other reasons are zooming or panning and changing periodicity. Those can trigger a fetch request as well. All these are handled by the quoteFeed callback function. There is where you will add the function to load all of the extra elements you need from the feed.
You will also need to add code in your calculate function to load the initial data when the study is called for the first time either because a user called for it, the user has refreshed the browser or the user has loaded the chart for the very first time and this study was stored in his preferences. Sample code can be provided upon request.
There are 2 cycles of updates every time you get new data. One is for the main symbol, and one is for anything else that you have on the quote feed callback.
When a fetch request is triggered , the data for the main symbol will be gathered and the chart will be rendered ( triggering a customDataLoader and calculateFN call). Then, the fetch callback will be called, so you will see one customDataLoader for each symbol in your study ( and any other studies) followed by a single calculateFN call. So if you have 3 symbols on your study and nothing else, on a refresh you will see 4 customDataLoader (one for each symbol including the main) and 2 calculateFN (one for the main symbol an done for the multifetch).
Modifying default delete/edit for special underlay studies
On the provided sample templates, some underlay studies like the 'Elder Impulse', 'Volume underlay' and the 'Volume profile' do no use the 'right click to manage' functionality. Instead a 'manage study' button will appear on the study drop-down menu along side the study name when these studies are active.
'Right click to manage' functionality is only available on standard series studies. The intersect logic built into the series renderers will detect the mouse being close to one of the series that composes a particular study and highlight it; allowing you you to delete it that way. This is not the case for studies that have more elaborate depictions which do not use series. So basically if the study is not rendered using a series, there will be no 'right click' hover option.
We have opted in our sample UI templates to add a 'manage' button on the study drop down. But this is all customizable and if you want to add a button anywhere else on the nav bars or canvas, you can most certainty do that. You may instead want to have a button 'pop-up' on the chart itself instead of being displayed on the menu.
The following API injection currently adds the delete/edit button in the menu drop down of our advanced template, but you can make any changes you want to display a button somewhere else if the study name is present in the stxx.layout.studies array.
This injection assumes that the studies requiring a button will be inside a div with id="menuWrapperStudies", tagged with a "customRemoval": true property in the study definition and have the additional HTML for displaying the button; including an id set to the study library key with dashes '-' instead of spaces (Elder-Impulse, for example).
<span class="your-class-for-the-button" id="study-name-with-dashes-goes-here"></span></li>The actual Elder Impulse definition with this property looks like this:
            "Elder Impulse": {
                "name": "Elder Impulse System",
                "calculateFN": STX.Studies.calculateElderImpulse,
                "seriesFN": STX.Studies.displayElderImpulse,
                "customRemoval": true,
                "underlay": true,
                "inputs": {},
                "outputs": {"Bullish":"#8BC176", "Bearish":"#DD3E39", "Neutral":"#5F7CB8"},
                "removeFN": function(stx, sd){
                    stx.chart.customChart=null;
                }
            },
The class style for the button looks like this:
.stx-edit-study {
    background-image: url(../img/stx-sprite.png);
    border-color: #ddd;
    float:right;
    width:15px;
    height:15px;
    display:none;
}
The complete HTML line for this study looks like this in our default template:
<li stxToggle="studyDialog(this, 'Elder Impulse');">Elder Impulse System<span class="stx-edit-study" id="Elder-Impulse"></span></li>You can find it all being used in stx-advanced.html.
/** This injection creates a legend for overlays that cannot be deleted with a right click **/
STXChart.prototype.append("draw", function(){
  if(!this.layout.studies) return;

  function closure(stx, name){
   return function(e){
    STX.MenuManager.menuOff();        // this is called hen the button is pressed
     e.stopPropagation();
     stx.rightClickOverlay(name);    // force the standard right click study removal to be called.
   };
  };
  for(var id in this.layout.studies){    // traverse trough all the active studies
    var sd=this.layout.studies[id];
    if(!sd.libraryEntry.customRemoval) continue;    // check to see if the 'customRemoval' flag is set
    var closeIcon=$$$("#menuWrapperStudies #" + sd.type.replace(" ","-"));    // check to see if the removal div san is present on the HTML
    if(closeIcon){
      closeIcon.style.display="inline-block";    // display the removal div
      if(!closeIcon.safeClickTouchEvents){
        STX.safeClickTouch(closeIcon, closure(this, sd.name));    // set the function that will be called when the buttn is pressed.
      }
    }
  }
});
To remove the button from the menu, you can use the stxx.callbacks.studyOverlayEdit or stxx.callbacks.studyPanelEdit