new YAxis()
Defines an object used for rendering the Y-axis on a panel.
Each panel object will include a YAxis object, which can be adjusted immediately after declaring your new STXChart();
Any adjustments to the Y-axis members after it has been rendered and will require a draw() call to apply the changes ( initializeChart() may be required as well depending on the setting being changed).
See Gridlines and axis labels, STXChart.AdvancedInjectable#createYAxis and STXChart.AdvancedInjectable#drawYAxis for additional customization instructions.
Example: stxx.panels['chart'].yAxis
Example: stxx.chart.panel.yAxis (convenience shortcut for accessing the main panel object - same as above)
Example: stxx.panels['Aroon (14)'].yAxis
Examples
// here is an example on how to override the default top and bottom margins after the inital axis has already been rendered
stxx.newChart(symbol, yourData, null, function () {    // call new chart to render your data
   	// callback - your code to be executed after the chart is loaded
		stxx.chart.yAxis.initialMarginTop=50;
		stxx.chart.yAxis.initialMarginBottom=50;
		stxx.calculateYAxisMargins(stxx.chart.panel.yAxis); // must recalculate the margins after they are changed.
		stxx.draw();
});
// here is an example on how to override the default top and bottom margins before the inital axis has been rendered
var stxx=new STXChart({container:$$$(".chartContainer"), layout:{"candleWidth": 16, "crosshair":true}});
stx.setPeriodicityV2(1, 1);  			// set your default periodicity to match your data. In this case one minute.
stx.chart.yAxis.initialMarginTop=50;		// set default margins so they do not bump on to the legend
stx.chart.yAxis.initialMarginBottom=50;
stx.newChart("SPY", yourData);
// here is an example on how to turn off the last price label (main chart panel) before the inital axis has already been rendered
var stxx=new STXChart({container:$$$(".chartContainer"), layout:{"candleWidth": 16, "crosshair":true}});
stxx.chart.panel.yAxis.drawCurrentPriceLabel=false;
Members
-
<static> defaultShadowBreaks :Array
-
Default setting for the array that determines how many decimal places to print based on the size of the shadow (the difference between chart high and chart low). The array consists of tuples in descending order. If the shadow is less than n1 then n2 decimal places will be printed. See STXChart.YAxis#shadowBreaks
Type:
- Array
- Since:
-
- 2015-11-1
- Default Value:
-
- ["[1000,2]","[1,4]"]
-
<static> smallChartShadowBreaks :Array
-
Alternative setting (for small charts) array that determines how many decimal places to print based on the size of the shadow (the difference between chart high and chart low). The array consists of tuples in descending order. If the shadow is less than n1 then n2 decimal places will be printed. See STXChart.YAxis#shadowBreaks
Type:
- Array
- Since:
-
- 2015-11-1
- Default Value:
-
- ["[10,2]","[1,4]"]
-
bottomOffset :Number
-
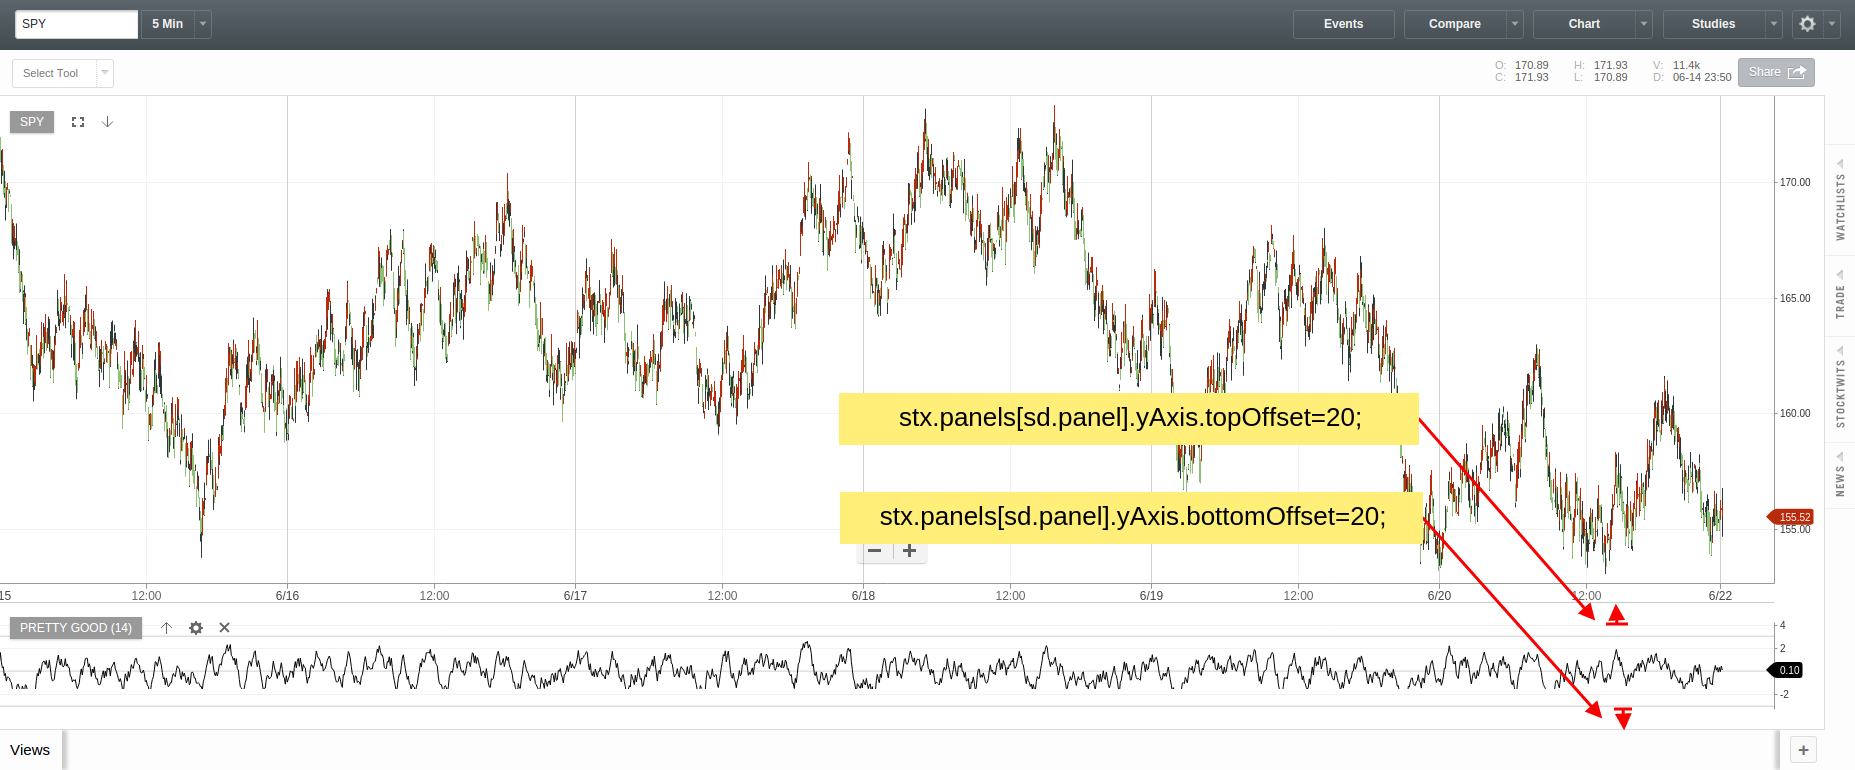
Sets the y-axis bottom on any panel. Rendering will start this number of pixels above the panel's bottom
Visual Reference:


Type:
- Number
- Default Value:
-
- 0
-
decimalPlaces :Number
-
0-4 or leave null and the chart will choose automatically. Note that this only affects the number of decimal places on the axis marks, not on the axis price labels (current price, indicators). See STXChart.YAxis#maxDecimalPlaces for controlling decimal places on price labels.
Type:
- Number
- Default Value:
-
- null
-
displayBorder :boolean
-
set to true to draw a line left of the y-axis and tick marks
Type:
- boolean
- Default Value:
-
- true
-
displayGridLines :boolean
-
set to false to hide grid lines. See Gridlines and axis labels for additional details.
Type:
- boolean
- Default Value:
-
- true
-
drawCurrentPriceLabel :Boolean
-
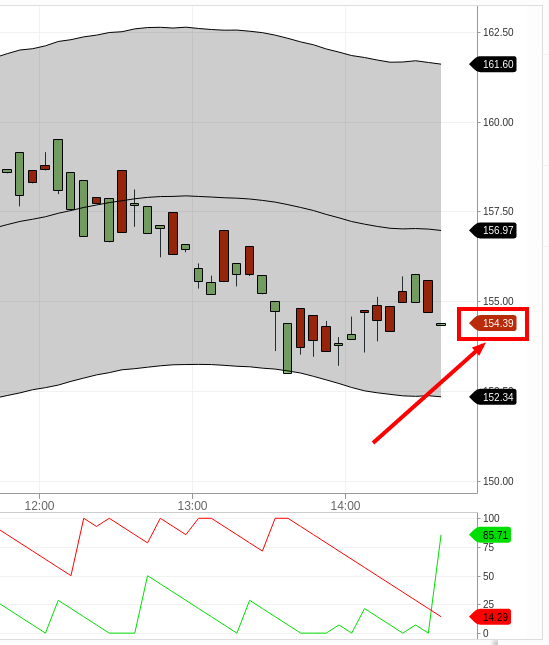
set to false to hide the current price label in the main panel's y-axis.
Visual Reference:

Type:
- Boolean
- Since:
-
- 04-2015
- Default Value:
-
- true
-
drawPriceLabels :Boolean
-
Set to false to hide all price labels on the particular y axis.
See STXChart.YAxis#drawCurrentPriceLabel to disable just the current price label on the main chart panel.
See STXChart.preferences.labels to disable just the last value label on studies.Type:
- Boolean
- Since:
-
- 04-2015
- Default Value:
-
- true
-
fractional :Object
-
Set to specify that the y-axis vertical grid be drawn with fractional intervals. This is checked in STXChart.AdvancedInjectable#drawYAxis and if it is not null, and there is no existing yAxis.priceFormatter, one is created to specially format the y-axis ticks.
Type:
- Object
- Default Value:
-
- null
Example
// Declare a STXChart object. This is the main object for drawing charts var stxx=new STXChart({container:$$$(".chartContainer"), layout:{"candleWidth": 16, "crosshair":true}}); // set axis to display in 1/32nds; for example, 100 5/32 will display as 100'05. If there is a price midway between // two ticks (for example, 11/64), a plus (+) will follow the price; for example 100 11/64 will display as 100'11+. stxx.chart.yAxis.fractional={ formatter: "'", // This is the character used to separate he whole number portion from the numerator (' default) resolution: 1/32 // Set to smallest increment for the quoted amounts -
idealTickSizePixels :Number
-
ideal size between y-axis values in pixels. Leave null to automatically calculate. See Gridlines and axis labels for additional details.
Type:
- Number
- Default Value:
-
- null
-
increments :Array
-
Values used by the STXChart.YAxis#pretty algorithm to set axis label locations.
Type:
- Array
- Since:
-
- 2015-11-1
- Default Value:
-
- [1,2.5,5]
-
initialMarginBottom :Number
-
set this to automatically compress and offset the y-axis to that this many pixels of white space is below the display Note that STXChart#calculateYAxisMargins will need to be called to immediately activate this setting after the axis has already been drawn.
Visual Reference:

Type:
- Number
- Default Value:
-
- 10
Examples
// here is an example on how to override the default top and bottom margins **before** the inital axis has been rendered
var stxx=new STXChart({container:$$$(".chartContainer"), layout:{"candleWidth": 16, "crosshair":true}});
stxx.setPeriodicityV2(1, 1);  				// set your default periodicity to match your data. In this case one minute.
stxx.chart.yAxis.initialMarginTop=50;		// set default margins so they do not bump on to the legend
stxx.chart.yAxis.initialMarginBottom=50;
stxx.newChart("SPY", yourData);
// here is an example on how to override the default top and bottom margins **after** the inital axis has already been rendered stxx.newChart(symbol, yourData, null, function () { // call new chart to render your data // callback - your code to be executed after the chart is loaded stxx.chart.yAxis.initialMarginTop=50; stxx.chart.yAxis.initialMarginBottom=50; stxx.calculateYAxisMargins(stxx.chart.panel.yAxis); // !!!! must recalculate the margins after they are changed. !!!! stxx.draw(); }); -
initialMarginTop :Number
-
Set this to automatically compress and offset the y-axis so that this many pixels of white space is above the display. Note that STXChart#calculateYAxisMargins will need to be called to immediately activate this setting after the axis has already been drawn.
Visual Reference:

Type:
- Number
- Default Value:
-
- 10
Examples
// here is an example on how to override the default top and bottom margins **before** the inital axis has been rendered
var stxx=new STXChart({container:$$$(".chartContainer"), layout:{"candleWidth": 16, "crosshair":true}});
stxx.setPeriodicityV2(1, 1);  				// set your default periodicity to match your data. In this case one minute.
stxx.chart.yAxis.initialMarginTop=50;		// set default margins so they do not bump on to the legend
stxx.chart.yAxis.initialMarginBottom=50;
stxx.newChart("SPY", yourData);
// here is an example on how to override the default top and bottom margins **after** the inital axis has already been rendered stxx.newChart(symbol, yourData, null, function () { // call new chart to render your data // callback - your code to be executed after the chart is loaded stxx.chart.yAxis.initialMarginTop=50; stxx.chart.yAxis.initialMarginBottom=50; stxx.calculateYAxisMargins(stxx.chart.panel.yAxis); // !!!! must recalculate the margins after they are changed. !!!! stxx.draw(); }); -
justifyRight :Boolean
-
Set to true to right justify the yaxis (use with STXChart.yaxisPaddingRight)
Type:
- Boolean
- Since:
-
- 15-07-01
- Default Value:
-
- null
-
max :Number
-
Optionally hard set the high (top value) of the yAxis (for instance when plotting 0 - 100% charts)
Type:
- Number
- Default Value:
-
- null
-
maxDecimalPlaces :Number
-
Maximum decimal places to ever display on a price label. Leave null and the chart will compute based on the number of decimal places in the actual data. Generally you want to leave this alone, in order to display the full actual current value of the security. But if you're running out of space on the y-axis, or you have a very tightly controlled configuration, you can lower this value. See STXChart.YAxis#decimalPlaces for controlling decimal places on the axis marks.
Type:
- Number
- Default Value:
-
- 5
-
min :Number
-
Optionally hard set the low (bottom value) of the yAxis (for instance when plotting 0 - 100% charts)
Type:
- Number
- Default Value:
-
- null
-
minimumPriceTick :Number
-
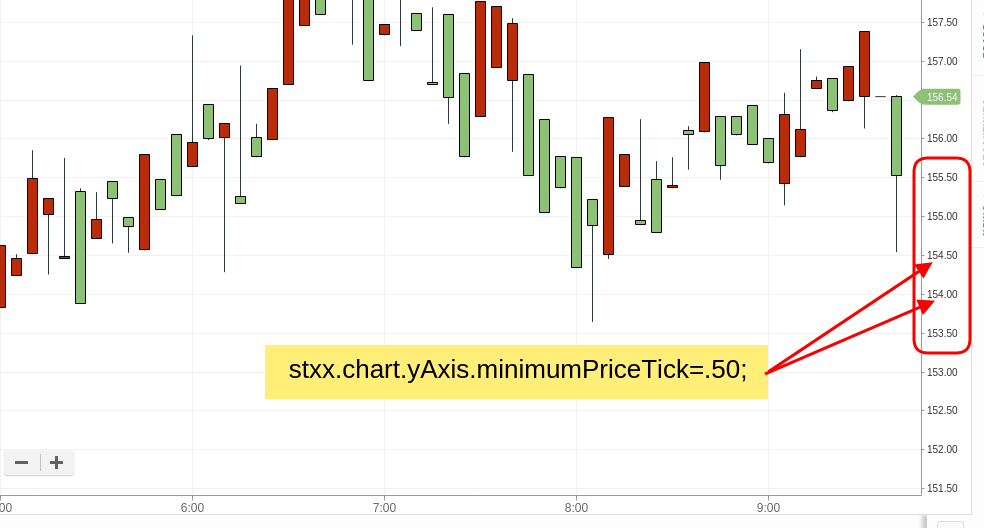
Set to specify that the y-axis vertical grid be drawn with specific intervals between ticks. This amount will be overridden if it will result in y axis crowding. In which chase, multiples of the original interval will be used. For example, if
.25is selected, and that will cause labels to be on top of or too close to each other,.50may be used. Crowding is prevented by allowing for a minimum of space equating the y-axis font height between labels.This parameter is also used in the 'Trade From Chart' (TFC) module. If set, it will force the widget to skip certain price values and instead 'snap' to your desired intervals. This will guarantee that an order is only placed at the allowed price intervals for the security in question.
Note that this flag is not compatible with STXChart.YAxis#pretty.
Visual Reference:

Type:
- Number
- Default Value:
-
- null
Example
// Declare a STXChart object. This is the main object for drawing charts var stxx=new STXChart({container:$$$(".chartContainer"), layout:{"candleWidth": 16, "crosshair":true}}); // set interval between ticks stxx.chart.yAxis.minimumPriceTick=.50; -
noDraw :boolean
-
set to true to hide the yaxis
Type:
- boolean
- Default Value:
-
- null
-
position :string
-
Set to "left" for the yaxis to draw on the left side of the screen. The main chart axis will default to "right". The main access for any study panel will follow the main chart axis as long as this is set to null. Note that this only applies to chart panels.
Type:
- string
- Since:
-
- 15-07-01
- Default Value:
-
- null
-
pretty :Boolean
-
If true then uses the "pretty" algorithm instead of the "best fit" algorithm. The pretty algorithm uses the values specified in STXChart.YAxis#increments to set axis label locations.
Note that this algorithm is not compatible with STXChart.YAxis#minimumPriceTick.
Type:
- Boolean
- Since:
-
- 2015-11-1
- Default Value:
-
- true
-
prettySemiLog :Boolean
-
If true then uses an additional step in the "pretty" algorithm for the log scale. This allows the algorithm to lower the grid to fill large visual gaps. The "increments" are not fully respected by this approach.
Only applicable when using both pretty mode and semiLog.
Type:
- Boolean
- Since:
-
- 2016-03-11
- Default Value:
-
- true
-
priceFormatter :function
-
Optional function used to override default formatting of Y-axis values, including the floating HUD value of the crosshair.
Expected format :
function(stx, panel, price, decimalPlaces)Parameters:
    {STXChart} stx            - The chart object
    {STXChart.Panel} panel    - The panel
    {number} price            - The price to format
    {number} decimalPlaces    - The number of decimal places to use
Returns:
{text} Formated text label for the priceType:
- function
- Default Value:
-
- null
Example
stxx.chart.panel.yAxis.priceFormatter=function(stx, panel, price){ var convertedPrice; // add our logic here to convert 'price' to 'convertedPrice' return convertedPrice; // string } -
scroll :Number
-
set this to the number of pixels to offset the y-axis, positive or negative.
Type:
- Number
- Default Value:
-
- 0
-
shadowBreaks :Array
-
An array that determines how many decimal places to print based on the size of the shadow (the difference between chart high and chart low). The array consists of tuples in descending order. If the shadow is less than n1 then n2 decimal places will be printed. See STXChart.YAxis.defaultShadowBreaks and STXChart.YAxis.smallChartShadowBreaks for default settings.
Type:
- Array
- Since:
-
- 2015-11-1
-
textBackground :Boolean
-
Set to true to put a rectangle behind the yaxis text (use with STXChart.yaxisPaddingRight)
Type:
- Boolean
- Since:
-
- 15-07-01
- Default Value:
-
- false
-
textStyle :string
-
Override the default stx_yaxis style for text by setting this to the desired CSS style. This would typically be used to set a secondary axis to a particular color.
Type:
- string
- Since:
-
- 15-07-01
- Default Value:
-
- null
-
topOffset :Number
-
Sets y-axis top on Study panels, Rendering will start this number of pixels below the panel's top
Visual Reference:

Type:
- Number
- Default Value:
-
- 0
-
width :Number
-
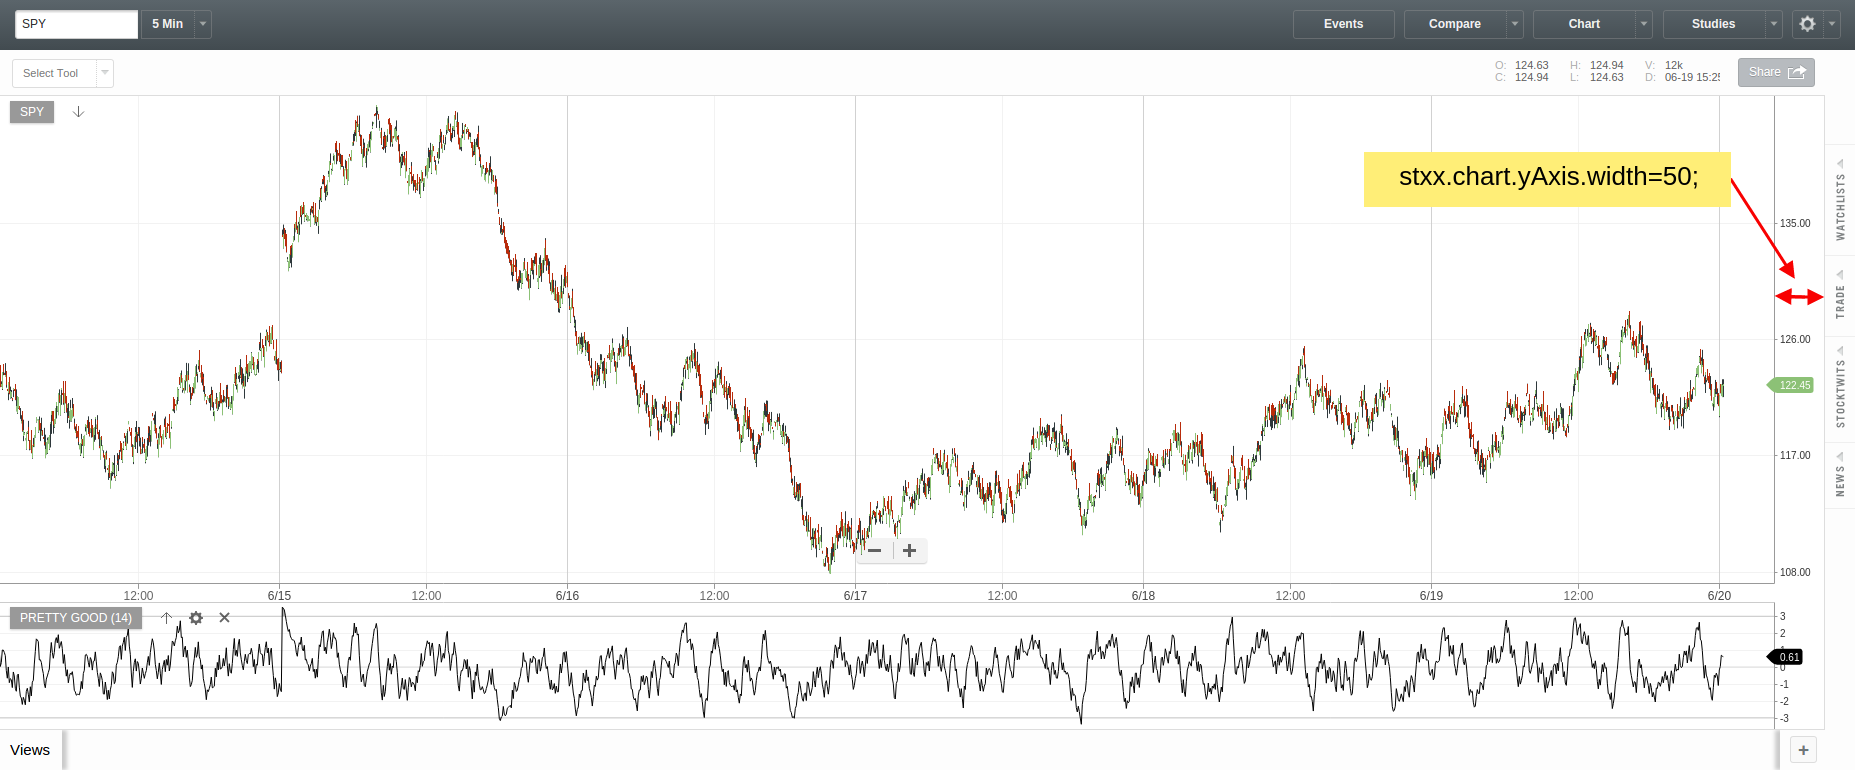
The width in pixels.
Visual Reference:

Type:
- Number
- Default Value:
-
- 50
-
yaxisLabelStyle :string
-
Set to either "roundRectArrow", "semiRoundRect", "roundRect","tickedRect","rect","noop". It will default to STXChartyaxisLabelStyle This could be set independently on each panel if desired.
Type:
- string
- Since:
-
- 04-2015
- Default Value:
-
- null
Example
var stxx=new STXChart({container:$$$(".chartContainer"), layout:{"candleWidth": 16, "crosshair":true}}); stxx.chart.yAxis.yaxisLabelStyle="rect" -
zoom :Number
-
Set this to the number of pixels to zoomed in or out, positive or negative. This is defined as the number of pixels to add or subtract from both top and bottom of panel for calculations.
Please note that the zoom level will be reset as determined by STXChart.YAxis#initialMarginTop and STXChart.YAxis#initialMarginBottom when a STXChart#newChart is rendered, the STXChart#home button is pressed, or when STXChart.AdvancedInjectable#touchDoubleClick is activated on a touch device.
Type:
- Number
- Default Value:
-
- 0