new XAxis()
Defines an object used for rendering the X-axis on the chart, which can be adjusted immediately after declaring your new STXChart();
The STXChart.XAxis object is part of the STXChart.Chart object and is used on the main charts only. There is only one x axis per chart container.
Colors and fonts for the x axis can be controlled by manipulating the CSS.
You can override the stx_xaxis class in stx-chart.css to change the font.
If you also want to control the color, you will need to override the defaults for .Light .stx_xaxis and .Dark .stx_xaxis styles found in stx-standard.css
For full customization instructions see:
Example: stxx.chart.xAxis
Example
var stxx=new STXChart({container:$$$(".chartContainer"), layout:{"candleWidth": 16, "crosshair":true}});
stxx.chart.xAxis.axisType="numeric";
Members
-
adjustTimeZone :boolean
-
If true, the user selected (default browser if none selected) timezone will be used on the x axis. If not set to true, the data timezone will be used even if a user timezone was set.
Type:
- boolean
- Default Value:
-
- true
-
axisType :string
-
Set to "ntb" for non time based rendering of the x-axis. See See STXChart#createTickXAxisWithDates
Set to "numeric" to render an x axis based on the "index" field instead of "Date" field to determine the label. See STXChart#createNumericXAxis
If not set, it will default to "ntb".
Type:
- string
- Default Value:
-
- null
-
displayBorder :boolean
-
Set to true to draw a line above the x-axis.
Type:
- boolean
- Default Value:
-
- true
-
displayGridLines :boolean
-
Set to false to suppress grid lines
Type:
- boolean
- Default Value:
-
- true
-
formatter :function
-
Optional function to format dates on x-axis. If defined, will be used to completely control x-axis formatting, including the floating HUD date of the crosshair .
Expected format :
function(labelDate, gridType, timeUnit, timeUnitMultiplier);Parameters:
    {Date} labelDate            - date to format in epoch (=new Date()) format

    {String} gridType            - "boundary" or "line" if formatting the axis labels.
                                    Not present if formatting the floating label.

    {Enumerated type} timeUnit    - STX.MILLISECOND, STX.SECOND, STX.MINUTE, STX.HOUR, STX.DAY,
                                    STX.MONTH, STX.YEAR, STX.DECADE

    {Number} timeUnitMultiplier    - how many timeUnits
Returns:
{text} Formated text label for the particular date passed inType:
- function
- Default Value:
-
- null
Example
stxx.chart.xAxis.formatter = function(labelDate, gridType, timeUnit, timeUnitMultiplier){ //your code here to format your string return "formated string" } -
futureTicks :boolean
-
Set to false to hide axis markings in the future.
Type:
- boolean
- Default Value:
-
- true
-
futureTicksInterval :number
-
Set to the number of minutes ticks will move by when iterating in "tick" interval.
Since 'tick' is not a time based display, there is no way to predict what the time between ticks will be. Ticks can come a second later, a minute later or even more depending on how active a particular instrument may be. As such, if iterating trough the market day in 'tick' periodicity, the library uses a pre-defined number of minutes to move around. This will be primarily used when deciding where to put x axis labels when going into the future in 'tick' mode.
Type:
- number
- Default Value:
-
- 10
Example
//You can override this behavior as follows: var stxx=new STXChart({container:$$$(".chartContainer"), layout:{"candleWidth": 16, "crosshair":true}}); stxx.chart.xAxis.futureTicksInterval=1; // to set to 1 minute, for example -
idealTickSizePixels :number
-
Ideal space between x-axis labels in pixels. If null then the chart will attempt a tick size and time unit in proportion to the chart. Please note that if
stxx.chart.yAxis.goldenRatioYAxisis set totrue, this setting will also affect the spacing between y-axis labels. Please note that this setting will be overwritten at rendering time if too small to prevent labels from covering each other. Not applicable if STXChart.XAxis#timeUnit is manually set. See Custom X-axis for additional details.Type:
- number
- Default Value:
-
- null
-
minimumLabelWidth :number
-
Minimum size for label. This ensures adequate padding so that labels don't collide with one another. Please note that this setting is used during the rendering process, not during the label spacing calculation process and will be overwritten if too small to prevent labels from covering each other. To modify at what interval labels will be placed, please see Custom X-axis for more details
Type:
- number
- Default Value:
-
- 50
-
timeUnit :number
-
Overrides default used in STXChart#createTickXAxisWithDates
Allowable values:- STX.MILLISECOND,
- STX.SECOND
- STX.MINUTE
- STX.HOUR
- STX.DAY
- STX.WEEK
- STX.MONTH
- STX.YEAR
- STX.DECADE
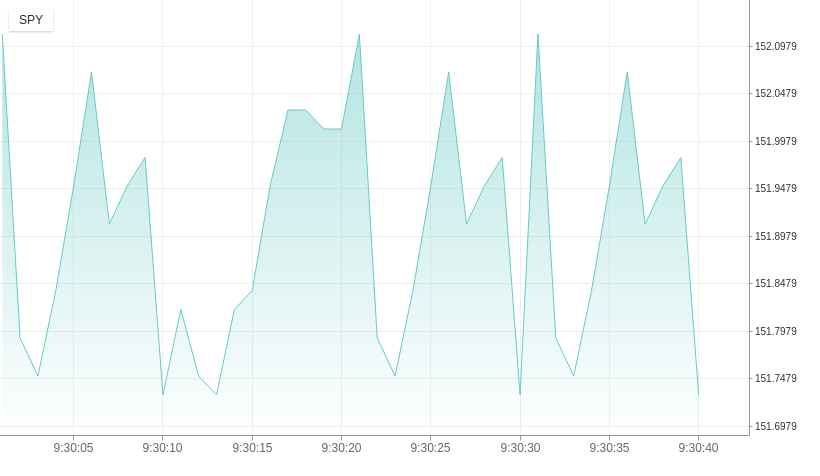
Visual Reference for sample code below ( draw a label every 5 seconds) :

Type:
- number
- Default Value:
-
- null
Example
// The following will cause the default implementation of createTickXAxisWithDates to print labels in seconds every 5 seconds.
// masterData is in 1 second intervals for this particular example.
stxx.chart.xAxis.axisType='ntb';
stxx.chart.xAxis.futureTicksInterval=1/60; // 1 second grouping
stxx.chart.xAxis.timeUnit = STX.SECOND;
stxx.chart.xAxis.timeUnitMultiplier = 5; // 5 units (e.g. seconds) grid line
-
timeUnitMultiplier :number
-
Overrides default used in STXChart#createTickXAxisWithDates
Type:
- number
- Default Value:
-
- null
Example
// The following will cause the default implementation of createTickXAxisWithDates to print labels in seconds every 5 seconds.
// masterData is in 1 second intervals for this particular example.
stxx.chart.xAxis.axisType='ntb';
stxx.chart.xAxis.futureTicksInterval=1/60; // 1 second grouping
stxx.chart.xAxis.timeUnit = STX.SECOND;
stxx.chart.xAxis.timeUnitMultiplier = 5; // 5 units (e.g. seconds) grid line