See Customization Basics and “Injection API" for more details on using API injections
Adding a horizontal line and price bubble pegged to a particular price-point
The following is a sample API injection that can be used to programmatically draw a horizontal line with the corresponding bubble tag at a specific price point on the chart. It also draws a vertical line at a specific date/time.
In this case, the horizontal line will follow the 'last price' and move up and down as it changes. The vertical line indicates the end of the market day.
Variables have been created to easily set the lines pattern, width and color.
Note that this injection will be added to the main draw loop as an append(). Therefore, it will be part of the animation process and will be executed after the main drawing function completes. Every time the chart redraws, to display a new tick or due to human interaction, this function will be called. To change the location of the line, add the required logic to set the desired price at each loop iteration. To remove the line, simply return before rendering anything; and the line will just not draw for that loop instance.
It also includes sample code for adding a label/message, and using native canvas functions to add a second line.
function injectionSample(){

    if (stxx.chart.dataSet.length){

        var parameters={
            pattern: "dashed",     // options: "solid","dashed","dotted"
            lineWidth: 2            // select any with for the line
        };

        /**************** display a last price horizontal line *****************/
        var panel = stxx.chart.panel;
        var price = stxx.chart.dataSet[stxx.chart.dataSet.length-1].Close;
        var x=stxx.pixelFromDate(stxx.chart.dataSet[stxx.chart.dataSet.length-1].Date, stxx.chart);
        var y=stxx.pixelFromPrice(price, panel);

        var color = "blue";        // select any color
        var type = "horizontal"; // don't change this setting since we are interested in drawing a horizontal line only with a bubble on the y-axis

        stxx.plotLine(x, x+1, y, y, color, type, stxx.chart.context, true, parameters);

        /***************** display a last price bubble on the y axis ***************/
        var txt=price;
        if(panel.chart.transformFunc) txt=panel.chart.transformFunc(stxx, panel.chart, txt);
        if(panel.yAxis.priceFormatter)
            txt=panel.yAxis.priceFormatter(stxx, panel, txt);
        else
            txt=stxx.formatYAxisPrice(txt, panel);
        stxx.createYAxisLabel(panel, txt, y, color);


        /************* write a message under the last price ****************/
        var context = stxx.chart.context;

        //write text
        context.font = '14pt Calibri';
        context.fillStyle = 'blue';
        context.fillText('This is the last price', x-150, y+10);

        /******************** write a vertical line using native canvas functions next to the message **************/
        //draw line using native canvas calls
        stxx.startClip(panel.name); // save current context
        context.beginPath();
        context.moveTo(x-155, stxx.pixelFromPrice(0,stxx.chart.panel));
        context.lineTo(x-155, stxx.pixelFromPrice(400,stxx.chart.panel));
        context.lineWidth = 2;
        context.setLineDash([2, 2]);
        context.strokeStyle = "green";
        context.stroke();
        stxx.endClip(); // restore previous context so all is back how it was.


        /************** display an end of market day vertical line only if in intraday periodicity *****************/
        if(!stxx.isDailyInterval(stxx.layout.interval) ) {
            color = "red";        // select any color
            type = "vertical"; // don't change this setting since we are interested in drawing a vertical line only

            var lastVisibleDate = stxx.chart.xaxis[stxx.chart.xaxis.length-1].DT;    // these are in  dataZone
            var firstVisibleDate = stxx.chart.xaxis[0].DT; // these are in  dataZone
            var now=new Date();
            // when working with the chart data, we must make sure the times are all in dataZone.
            // So if there is a datazone set, convert the browser time to the data time zone.
            if(this.dataZone){
                // convert the current time to the dataZone
                var tzNow = STX.convertTimeZone(now, null, this.dataZone);
                // remember the the masterData is in local time but really representing the dataZone time.
                // now build a browser timezone time using the dataZone time so it will match the offset of the existing data in masterData.
                now = new Date(tzNow.getFullYear(), tzNow.getMonth(), tzNow.getDate(), tzNow.getHours(), tzNow.getMinutes(), tzNow.getSeconds(), tzNow.getMilliseconds());
            }
            if ( !stxx.chart.market.isOpen() ) {
                now= stxx.chart.market.getPreviousOpen(now);
            }
            var currentClose= stxx.chart.market.getPreviousClose(now);

            if ( currentClose >= firstVisibleDate && currentClose <= lastVisibleDate ) {
                    // the current close is visible in the chart...
                    x = stxx.pixelFromDate(STX.yyyymmddhhmm(currentClose), stxx.chart);
                    stxx.plotLine(x, x, 0, 0, color, type, stxx.chart.context, true, parameters);
            }
          }
     }
}

STXChart.prototype.append("draw", injectionSample);
Snap Y cross-hair line to specific price intervals
This example snaps the Y cross-hair to even numbers but you can customize it to snap to any price interval you may need. For example, certain instruments only trade in .25 cents intervals. You can adjust this injection to do that.
STXChart.prototype.prepend("doDisplayCrosshairs", function(){

            var price = this.priceFromPixel(this.crossYActualPos);
            var difference= price % 2;
            if( difference ) {
                this.crossYActualPos= this.pixelFromPriceTransform(price-difference,this.chart.panel);
                if( this.chart.panel.yAxis.bottom < this.crossYActualPos ) this.crossYActualPos=this.chart.panel.yAxis.bottom;
                this.controls.crossY.style.top=this.crossYActualPos + "px";
            }
});
Preventing scrolling and zooming beyond the existing dataSet
The following is a sample API injection that can be used to prevent users from scrolling or zooming into the past or future.
function preventPastScrollandZoom(){

    if( !stxx.chart.dataSet.length) return; // no data to show.

    if ( stxx.chart.dataSegment )
           console.log('datSet : '+stxx.chart.dataSet.length+' | datSegment : '+stxx.chart.dataSegment.length+' | scroll : '+stxx.chart.scroll+' | microscroll : '+stxx.microscroll+' | micropixels : '+stxx.micropixels+' | candleWidth : '+stxx.layout.candleWidth+' | maxticks : '+stxx.chart.maxTicks);
    else
           console.log('datSet : '+stxx.chart.dataSet.length+' | datSegment : NOT available'+' | scroll : '+stxx.chart.scroll+' | microscroll : '+stxx.microscroll+' | micropixels : '+stxx.micropixels+' | candleWidth : '+stxx.layout.candleWidth+' | maxticks : '+stxx.chart.maxTicks);


    if(stxx.chart.dataSet.length < stxx.chart.maxTicks) {                                            // not enough data to fill the screen
        console.log('overiding scroll and zoom -- not enough data to fill screen');
        // reset scroll
        stxx.chart.scroll=stxx.chart.dataSet.length-1;
        stxx.micropixels=0;
        // stop zooming also
        stxx.setCandleWidth((stxx.chart.width)/stxx.chart.dataSet.length);
    } else {
        if( (stxx.chart.scroll == stxx.chart.dataSet.length+1 && stxx.micropixels > 0) ||            // creating white space on the left
            (stxx.chart.scroll > stxx.chart.dataSet.length+1) )
        {
                console.log('creating white space on the left');
                // reset scroll
                stxx.chart.scroll=stxx.chart.dataSet.length+1;
                 stxx.micropixels=0;
        } else if(stxx.chart.scroll < stxx.chart.maxTicks) {                                         //creating white space on the right
                console.log('creating white space on the right');
                // reset scroll
                stxx.chart.scroll=stxx.chart.maxTicks;
                 stxx.micropixels=0;
        }
    }

    console.log('________________________________________________________');
}
STXChart.prototype.prepend("draw", preventPastScrollandZoom);
Converting zoom mode into a scroll mode
Some times the zoom feature can be cumbersome to use on some browsers, such as in small mobile devices. The following injection will convert the zooming into scrolling if using a touch device.
function disableZoom() {
    if(STX.touchDevice) {
        // you can set the candle width to whatever value you like to see on the screen and will not allow zooming in or out of that factor.
        stxx.setCandleWidth(18, stxx.chart);
    }
}
STXChart.prototype.prepend("draw", disableZoom);
The following device/browser checks are supported:
    STX.ipad
    STX.iphone
    STX.isSurface
    STX.touchDevice
    STX.is_chrome
    STX.isAndroid
    STX.isIE
    STX.isIE9
    STX.isIE8
    STX.isIOS7
    STX.isIOS8
    STX.isIOS7or8
    STX.isSurfaceApp
    STX.noKeyboard
Please note that if you wish to completely disable zooming you probably want to do so when you declare the chart using the allowzoom parameter..
Example:
var stxx=new STXChart({container:$$$(".chartContainer"), allowZoom:false, layout:{"candleWidth": 16, "crosshair":true}});Adding close price for comparison symbols on heads-up display
Here are the general steps to get this done.
On your main HTML file there will be the rendering potion for the display (search for 'V:', for example, to get there).
Code right now looks something like this (I am using stx-advanced.html for my code samples, but if you use different files, they should have similar code):
    <ul class="hu">
        <li><span class="huLabel">O: </span><span id="huOpen" class="huField"></span></li>
        <li><span class="huLabel">H: </span><span id="huHigh" class="huField"></span></li>
        <li><span class="huLabel">V: </span><span id="huVolume" class="huField"></span></li>
        <li><span class="huLabel">C: </span><span id="huClose" class="huField"></span></li>
        <li><span class="huLabel">L: </span><span id="huLow" class="huField"></span></li>
    </ul>
There, you can add anything else you want to display. Right now this is static rendering, so you will need to add some more code to the java script function that updates the values to also display your comparison symbols dynamically as they are added or removed.
That takes us to the next portion of the code you should review:
There is an API injection that is currently used to update the values on the heads up display. This is where you will be doing most of your work. If you do not have one, you can add it to the html file. Code looks something like this:
// Update the head's up display
function prependHeadsUpHR(){
    var tick=Math.floor((STXChart.crosshairX-this.chart.left)/this.layout.candleWidth);
    var prices=this.chart.xaxis[tick];

    $$("huOpen").innerHTML="";
    $$("huClose").innerHTML="";
    $$("huHigh").innerHTML="";
    $$("huLow").innerHTML="";
    $$("huVolume").innerHTML="";
    if(prices!=null){
        if(prices.data){
            $$("huOpen").innerHTML=this.formatPrice(prices.data.Open);
            $$("huClose").innerHTML=this.formatPrice(prices.data.Close);
            $$("huHigh").innerHTML=this.formatPrice(prices.data.High);
            $$("huLow").innerHTML=this.formatPrice(prices.data.Low);
            $$("huVolume").innerHTML=STX.condenseInt(prices.data.Volume);
        }
    }
}
STXChart.prototype.prepend("headsUpHR", prependHeadsUpHR);
As far as where to get the data. Here is the information you would need:
stxx.chart.series will contain an array of all symbols being compared. You can iterate trough that to get the list and display it on the screen.
Each element will have a filed called 'display'. For example ; display: "IBM".
The data on the stxx.chart.dataSegment will have the actual close for any symbol that is being compared. So you would use the stxx.chart.series array to get the list of symbols, and then use the dataSegment array to get the actual close.
The stxx.chart.dataSegment array elements will look something like this ( I highlighted 2 symbols that would be part of a comparison :
Adj_Close: 130.12
Close: 130.12
Date: "2012-03-07"
High: 130.33096912079003
**IBM: 197.77**
**INTC: 26.91**
Low: 129.39119758272534
Open: 129.51586115410126
Volume: 143692200
atr: 1.1490468537796275
It is up to you do decide the layout for this information. This tutorial is intended t provide the underlying concepts to get it done. Good luck!
Adding a confirmation pop-up before deleting a highlighted item from the chart.
Currently once an item such as a overly study or drawing is highlighted, right clicking on it deletes it. You may prefer for a message to pop-up, giving the user a chance to explicitly confirm the deletion and prevent accidental removals.
This can be done by adding a prepend to the deleteHighlighted function. The following example uses the built in 'confirm' call, but you can add any confirmation logic and layout you wish.
function prependDeleteHighlighted(){
    if (confirm("Are you sure you want to delete this item?") != true) {
            return true;
    }
}

STXChart.prototype.prepend("deleteHighlighted", prependDeleteHighlighted);
Adding a Striped background on a chart.
The following is injection API sample for appending functionality to the "plotYAxisGrid" function, which is used to draw the horizontal grid lines on a chart. This sample code creates an alternating background. The function utilizes the data stored in the Plotter's cache which is used to store the locations for the grid lines. It iterates trough the line drawing instructions (lineTo, moveTo) to locate the starting x & y coordinates and corresponding offsets, to render rectangles that lay perfectly within alternating grid lines. There is also code included to handle the special case for rendering the very first highlight from the top, which could at times be of partial height.
function appendPlotYAxisGrid(panel){
    if(panel.name !='chart') return;
    this.chart.context.fillStyle="orange"; /// set your color here
    for(var i=0;i<panel.yAxisPlotter.seriesArray.length;i++){
        var series=panel.yAxisPlotter.seriesArray[i];
        if(series.name!="grid") continue;
        var startx;
        var starty;
        for(var j=0;j<series.moves.length;j++){
            var move=series.moves[j];
            if(move.action=="moveTo"){
                startx=move.x;
                starty=move.y;
                // if there will be no more lines..we need to color the last partial grid if it is not exactly at the top of the screen
                if(j+2 >= series.moves.length && starty) {
                    // last bar
                    if (series.moves.length > j+1) {
                        this.chart.context.fillRect(startx, starty, series.moves[j+1].x-startx,starty*=-1);
                        console.log (startx, starty, series.moves[j+1].x-startx,starty*=-1);
                    }
                }
                j++; //skip the next lineTo stored in the plotter cache
                j++; //skip the next moveTo    stored int he plotter cache

            }
            if(move.action=="lineTo"){
                this.chart.context.fillRect(startx, starty,move.x-startx,move.y-starty);
            }
        }
    }
}
STXChart.prototype.append("plotYAxisGrid", appendPlotYAxisGrid);
Adjusting initial Panel height for a study
You can do this by creating a prepend for the 'createPanel' function, which inserts the study panels into the layout. Here is sample code that can be included in your project and modified as needed. Please note that by default, ALL panels are proportionally adjusted every time a new panel is added to the layout or the window size changed. So you need to have your code deal with that and ensure you maintain the ratios you want to see on the final layout.
In this example we preset the Aroon study panel to a height of 100px. It uses the panel name to determine the required height. Please note that study panel names do include the period as part of the name, so you need to ensure you are comparing against the correct name. In this case, the complete name of the study would be Aroon (14), if a period of 14 is selected. To prevent any conflicts, the code is comparing the name to "Aroon (" to ensure enough uniqueness since there are other Aroon studies, which also begin with "Aroon" The complete list of study panel names can be seen in the STX.Studies.studyLibrary.
function prependCreatePanel(display, name, height, chartName){
    // this should be the LAST prepend on the injection chain.

    // here is an example of a predefined size for a panel. Remember that as more are added, all percentages are recalculated, so you need to manage that.

    if ( name.indexOf("Aroon (")!=-1 ) {
        height=100;
    }

    if(!chartName) chartName="chart";
    var h=this.chart.canvasHeight;
    if(!height){
        height=h*.20; // default is 20% of the screen.
    }
    var percent=height/h;

    // here we go trough all existing panels and adjust their percentages as needed to make room for the new panel that is about to be added
    // add your code here to decide how you want to adjust your panels as more are added to maintain the sizes you want.
    // this code is adjusting all panes...but you will need to change that.

    var reduce=1-percent;
    for(var p in this.panels){
        var panel=this.panels[p];
        panel.percent*=reduce;
    }

    // once you have adjusted the percentages of existing panels to what you want, add the new panel for the new study with the size you want.
    this.stackPanel(display, name, percent, chartName);

    // this just completes the work...
    this.adjustPanelPositions();
    this.savePanels(false);
    this.runAppend("createPanel", arguments);
    return true;
}
STXChart.prototype.prepend("createPanel", prependCreatePanel);
If you want to disable user resizing of panels, you can turn off the resizing handle by adding the following to your CSS:
.stx-ico-handle
    display: none;
}
Disabling/enabling touch and mouse events
The following disables all events except the mouse wheel:
STXChart.prototype.prepend("mousemoveinner", function(){
 // add your logic to decide if you want the events handled or not...maybe via some sort of global variable, or stxx.member variable....
 //return true; //when you want to have the events disabled
 //return false; //when you want to have the events enabled
});
Disabling/enabling the Mouse wheel
The following only disables the mouse wheel:
STXChart.prototype.prepend("mouseWheel",function(){
// add your logic to decide if you want the events handled or not...maybe via some sort of global variable, or stxx.member variable....
 //return true; //when you want to have the events disabled
 //return false; //when you want to have the events enabled
});
Customizing colored line charts to include dashes on flat-lines
The following will render dashed lines when there is no change or markets are closed/inactive causing a flat line on the chart. Similar customizations can be done for other chart types. See STXChart.Chart#customChart.colorFunction
function dottedLines(){
    if ( stxx.layout.chartType =="colored_line")
        stxx.chart.customChart={
            colorFunction:function(stx, quote, mode){
                 var stxLineUpColor=stxx.getCanvasColor("stx_line_up");
                var stxLineDownColor=stxx.getCanvasColor("stx_line_down");
                var stxLineColor=stxx.getCanvasColor("stx_line_chart");

                if(quote.Close>quote.iqPrevClose) return stxLineUpColor;
                else if(quote.Close<quote.iqPrevClose) return stxLineDownColor;
                else return {color:stxLineColor,pattern:[1,3]};
            }
        }
    else
        stxx.chart.customChart = null;
}
STXChart.prototype.prepend("draw", dottedLines);
A canvas alternative to Markers
There are times when HTML Markers may not provide optimal performance. This is the case when a very large number of markers are required to render simultaneously on the chart. Other times, you may need the markers to appear in an exported image generated using the STXSocial plug-in. An alternative is to render them directly on the canvas.
The following injection is an example on how to do this:
function markerInjection(){
var markerList=[
new Date(2015, 9, 15, 15, 12),
new Date(2015, 9, 20, 9, 00),
new Date(2015, 10, 30, 12, 30),
new Date(2015, 10, 30, 13, 45),
new Date(2015, 10, 30, 14, 30),
new Date(2015, 10, 30, 15, 30),
new Date(2015, 10, 30, 16, 30),
new Date(2015, 10, 30, 17, 30)
];
if (stxx.chart.dataSegment.length){
var panel = stxx.chart.panel;
var ctx = stxx.chart.context;
stxx.startClip(panel.name); // save current context
for(var j=0;j<markerList.length;j++){
for(var i=stxx.chart.dataSegment.length-1;i>=0;i--){
// find the tick you want this on
if ( stxx.chart.dataSegment[i].DT <= markerList[j]) {
// this code finds the actual tick or the one right before to put the marker on.
var price;
var useHighs=STXChart.chartShowsHighs(stxx.layout.chartType);
if( useHighs ) {
price = stxx.chart.dataSegment[i].High;
} else {
price = stxx.chart.dataSegment[i].Close;
}
var x=stxx.pixelFromDate(stxx.chart.dataSegment[i].Date, stxx.chart);
var y=stxx.pixelFromPrice(price, panel)-20; // place 20 pixels over the line/candle
// draw a circle
ctx.beginPath();
ctx.lineWidth=1;
var radius= 12;
ctx.arc(x, y, radius, 0, 2*Math.PI, false);
ctx.fillStyle="green";
ctx.strokeStyle="black";
ctx.fill();
ctx.stroke();
ctx.closePath();
//write leter in the circle
ctx.font = '10pt Calibri';
ctx.fillStyle = 'white';
ctx.fillText('T', x-4, y);
break;
}
}
}
stxx.endClip(); // restore previous context so all is back how it was.
}
}
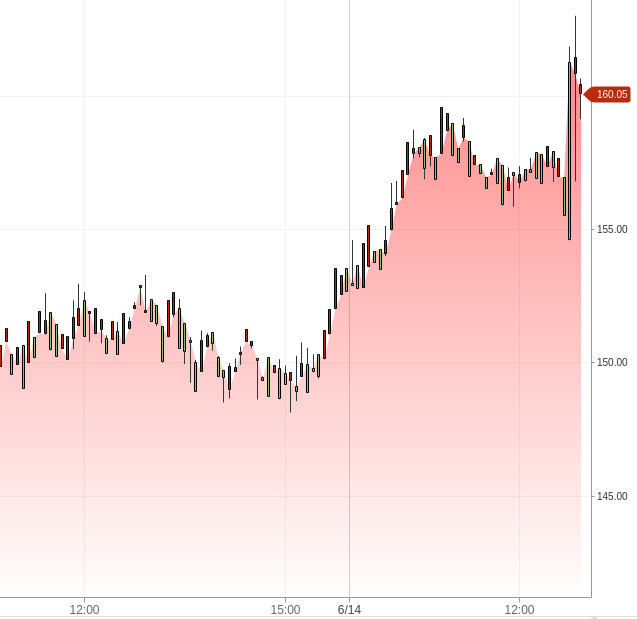
STXChart.prototype.append("draw", markerInjection);Adding a mountain gradient to the candle chart.
You can add a gradient to the candle chart by using a prepend to the "displayChart" function as follows:
STXChart.prototype.prepend("displayChart", function(){

 if(this.layout.chartType=="candle"){
  stxx.startClip(stxx.chart.panel.name);
  stxx.drawMountainChart(stxx.chart.panel,"custom_candle_mountain");
  stxx.endClip();
 }
});
Put this function call anywhere in your code after the kernelOs.js file was loaded.
You will also need to have the following CSS entry:
.custom_candle_mountain {
 background-color: rgba(255, 0, 0, .5);    /* background color for mountain.*/
 color: rgba(255, 0, 0,.01);    /* Optional gradient.*/
}
Your chart will resemble something like this:
Suppressing the y-Axis auto adjust as chart is panned left or right
By default, the chart will auto adjust (zoom in or out the y axis) to display all candles for the viewing period . If you wish for your chart to continue using the initial y axis zoom level, and allow ticks to fall off the chart on the top or the bottom, you can add the following prepend and append functions to maintain that level:
STXChart.prototype.prepend("initializeDisplay", function(chart){
    currentGlobalLow = chart.lowValue;
    currentGlobalHigh = chart.highValue;
});

STXChart.prototype.append("initializeDisplay", function(chart){

    if ( typeof activeSymbol =="undefined" ) activeSymbol = chart.symbol;
    else if ( activeSymbol == chart.symbol ) {
        if ( currentGlobalLow ) chart.lowValue = currentGlobalLow;
        if ( currentGlobalHigh ) chart.highValue = currentGlobalHigh;
    } else {
        activeSymbol = chart.symbol;
    }
});
Adding a highlight on the 'mouse-over' bar.
This set of injections will produce a highlight behind the bar of the current cross-hair (mouse/pointer) location, even if cross hairs are off.
Both injections are needed.
STXChart.prototype.prepend("draw", function(){
    var tick=this.barFromPixel(this.cx);
    var price=this.chart.xaxis[tick];
    if( price && price.data ) {
        var pixel = this.pixelFromDate(price.data.DT);
        var pixel = pixel-stxx.layout.candleWidth/2;
        var boxWidth = stxx.layout.candleWidth;
        var boxHeight = stxx.chart.panel.top+stxx.chart.panel.height;

        var ctx = this.chart.context;
        ctx.beginPath();
        ctx.globalAlpha=.3;
        ctx.rect(pixel, stxx.chart.panel.top, boxWidth, boxHeight);
        ctx.fillStyle = '#87CEEB';
        ctx.fill();
        ctx.strokeStyle = '#87CEEB';
        ctx.stroke();
        ctx.globalAlpha=1;
    }
});
STXChart.prototype.append("headsUpHR", function(){
    // to trigger the bar highlight
    this.draw()
});
Adding a label that stays properly placed as the chart size changes or new panels are opened.
If you are trying to add a label that will remain properly located on the main chart panel as new study panels are opened or the size of the chart changes, here are the instructions:
First put a div for the disclaimer on your page:
<div class="stx-disclaimer">Then style it (in the CSS file):
.stx-disclaimer {
    position:absolute;
    bottom:50px;
    left:10px;
    display:block;
    font-size:13px;
    color:#929292;
    padding:7px 12px 12px;
    background:rgba(0,0,0,.05);
    border-style: solid;
    border-width: 1px;
    width: 386px;
    /*height: 45px;*/  /* let it adjust based on text length */
}
Add anything you want to the HTML to display your text, or dynamically add code in the js to set it like so:
$$$(".stx-disclaimer").innerHTML='Your text here';Then add the following injection to move it as studies are added or the size of the window changes:
STXChart.prototype.append("adjustPanelPositions", function(){
    // this places and maintains the disclaimer 48 pixels above the bottom edge of the main chart panel
    $$$(".stx-disclaimer").style.bottom=(this.chart.canvasHeight-this.panels.chart.bottom+48)+"px";
});
That should do it.
Performing additonal actions after a pinching gesture
The following injection will trigger once your pinching or reverse pinching gesture is completed. You can add code here to perform any functions you need upon completing a zoom action on a touch device. Note that this will only trigger once your fingers move away from the screen and will not trigger while you continue to pinch in and out.
STXChart.prototype.append("touchend", function(){
    if( this.pinchingScreen>1 ) {
    alert('was zooming');
    // add your code here to trigger any additional action once the zoom is completed on a touch device.
    }
});
Triming pagination data as new current ticks are added
There are times when current ticks need to be added at a very fast pace. As such, to prevent the masterData array to grow to an unmanageable size, you may want to trim the older historical data to maintain it at a certain size.
This injection will accomplish that:
STXChart.prototype.prepend('appendMasterData', function () {
        // prevent the paginated data to get too large as the data grows from adding new current ticks.
        var maxSize=1000;
        if (stxx.chart.masterData.length > maxSize+60 ) {    // do it only every 60 ticks for added deficiency
            // reset the availabe flag so we can paginate again if needed.
            stxx.chart.moreAvailable=true;
            stxx.chart.masterData=stxx.chart.masterData.slice(maxSize*-1)
        }
});
Format the Crosshairs floating x-axis label
stxx.chart.xAxis.formatter formats both the x-axis labels and the Crosshairs floating x-axis label (HUD). This injection provides a means to override the Crosshairs floating x-axis label only.
STXChart.prototype.append("headsUpHR", function(){
     console.log(this.currentPanel.chart.xaxis[this.barFromPixel(this.cx)]); // Original date object.
     console.log("Formatted date: " + this.controls.floatDate.innerHTML); // Formatted date.
     //Custom formatting code here...
     this.controls.floatDate.innerHTML="Custom " + this.controls.floatDate.innerHTML; // Additional formatting prior to display in HUD.
});